Application Logging & Log Draining in Cloud Foundry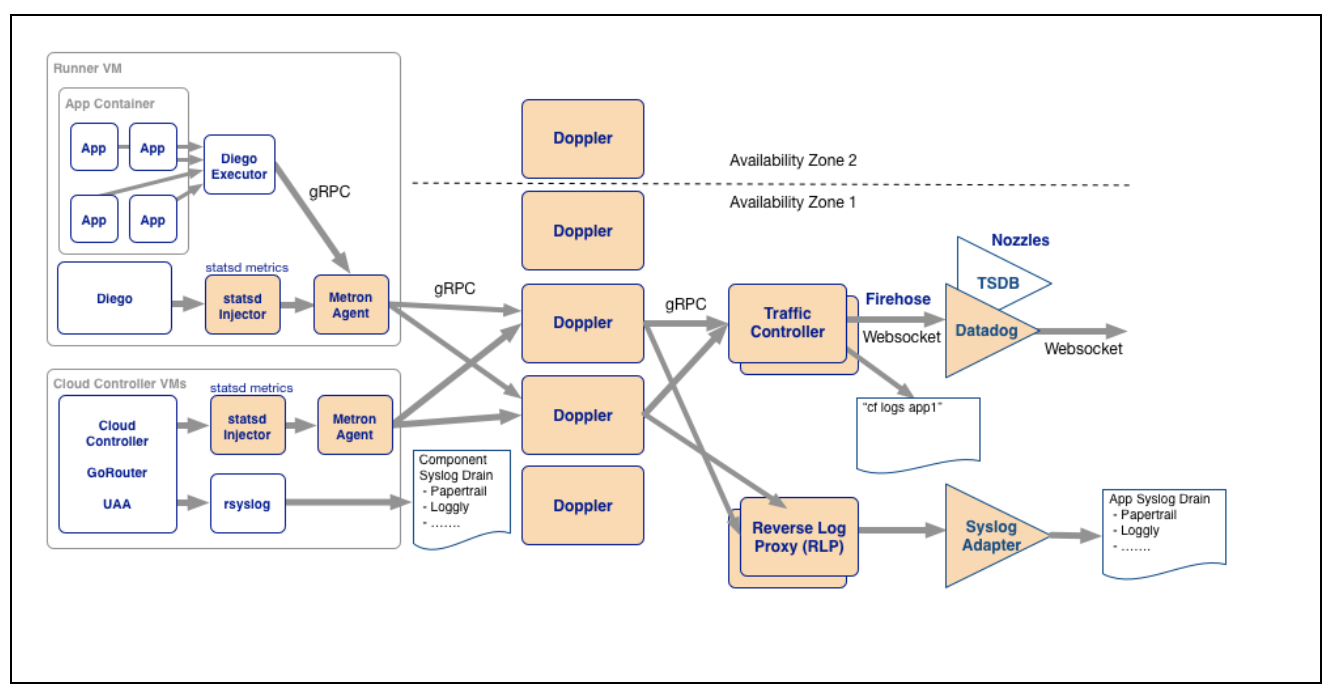
Introduction
The main goal of this blog post is to provide necessary information to get started on using Cloud Foundry Logging Component. A little introduction to concepts like Cloud-Native Apps, 12 Factor Apps is needed to understand System and Application logging on Cloud. Here is the breakdown of this blog post.
- The purpose of aggregating logs from all running instances of an application on cloud.
- How the aggregation of logs is handled on Open-Source PaaS - Cloud Foundry.
- How easy it is to route the log streams to a specialized log management system - Papertrail.
Prerequisite
This article assumes you are familiar with
- Cloud foundry
- A brief understanding of Cloud Native Applications.
- A high-level understanding of 12 Factor Apps concepts.
I have provided links to various resources at the end of this article to get an understanding of these concepts before you go on and read this blog post.
Why do we need to aggregate logs?
Cloud Native Apps
Applications designed and developed to take advantage of cloud features are supposed to be called cloud native apps. Following constraints makes cloud native applications difficult to troubleshoot.
- Distributed applications like microservices hard to maintain, and debug.
- Applications on cloud run on Virtual machines and(or) Containers which are ephemeral.
- Container Instances are immutable.
Because of these constraints storing, analyzing application and system log information is difficult.
12 factor Apps
12 factor apps is like a benchmarking to make sure your application is built for cloud (like microservices) and following certain recommendations.
Among the 12 factors following four factors are pertinent to topic of this post.
- Processes - 12 factor apps are supposed to be state-less so that scaling is easy.
- Concurrency - For high availability multiple instances of an App are run and load is distributed across.
- Disposability - To scale-out and scale-in, Apps should be quick to boot-up and easy to be disposable.
- Logs - 12 factor apps recommends treating logs from all app instances as event streams, never store them inside containers or virtual machines.
Logs should be streamed out and stored somewhere else and should be aggregated not to loose them.
What component of Cloud Foundry handles logging?
Cloud Foundry Loggregator Component
A brief introduction to Cloud foundry
Cloud Foundry is an open-source Platform-As-A-Service (Paas) to run applications on any cloud. Instead of focusing on Cloud infrastructure CF abstracts all the operational activities and provides a platform to speedup application development and deployment. Various components of CF address certain factors of 12 factor operations. Loggregator component of CF takes care of aggregation of logs from all running instances of an application.
Following diagram explains various sub components within PCF Loggragator Component.
Loggregator
Cloud Foundry Loggregator component aggregates logs from all app instances for you. All the developer needed to do is direct the logs to standard OUT and standard ERROR.
Loggreator comprises of two sub-components
- Doppler: Receives app syslogs from Metron agents. These can be further redirected to log drain systems like Papertrail or Loggly.
- Traffic Controller: Collects both syslogs and metrics data. Syslogs can be pulled out from CFCLI command $cf logs. Or CF administrators can setup Nozzles to direct metrics data to third party APM (Application Performance Monitoring) tools like NewRelic.
How can we take advantage of CF Loggregator?
A quick lab using Pivotal Cloud Foundry and Papertrail Managed Log Management System.
> Push sample application onto PCF
To demonstrate log drain lets quickly build a sample Spring boot application. Please go to http://start.spring.io. Configure a sample Spring boot application with Web Starter dependency.
Here is the Sample Spring Boot Application for this lab. I just added a REST Controller which logs a log message appending the name it receives from the API call.
@SpringBootApplication
public class PcflogApplication {

	public static void main(String[] args) {
		SpringApplication.run(PcflogApplication.class, args);
	}

	@RestController
	@RequestMapping("api/v1")
	public class PcfLogDemo {
		Logger logger = LoggerFactory.getLogger(PcfLogDemo.class);

		@GetMapping("hello/{name}")
		public ResponseEntity<String > sayHello(@PathVariable String name) {
			logger.info(name + ": Your log statement");

			return ResponseEntity.ok().body(name + ": Your Log statement.");
		}
	}
Please go ahead and build the application using Maven. After successful build the app should be available under target/{your app}.jar. Maven build log of the sample application.
[INFO] --- maven-jar-plugin:3.0.2:jar (default-jar) @ pcflog ---
[INFO] Building jar: /Users/msambangi/Downloads/pcflog/target/pcflog-0.0.1-SNAPSHOT.jar
[INFO]
[INFO] --- spring-boot-maven-plugin:2.0.0.RELEASE:repackage (default) @ pcflog ---
[INFO] ------------------------------------------------------------------------
[INFO] BUILD SUCCESS]
> Signup for free account on Pivotal Web services
Now our sample app is ready to be deployed on Pivotal Cloud Foundry. Please go ahead and create a free account @ Pivotal Web services.
After an account was setup on PWS. Please download and setup CFCLI on your machine. CFCLI provides access to PWS from command line tool. Here is how you need to login to PWS from your command line tool of choice.
~/Downloads/pcflog $ cf login
API endpoint: https://api.run.pivotal.io

Email> <email associated with PWS account>

Password>
Authenticating...
OK

Targeted org cloudmonkey

Targeted space development


API endpoint:   https://api.run.pivotal.io (API version: 2.103.0)
User:           <email associated with PWS>
Org:            cloudmonkey
Space:          development
~/Downloads/pcflog $
After successful login you would see similar information above with your org name, and space. My target SPACE is development under ORG cloudmonkey. You may setup your choice of ORG and SPACE when you signup.
Pushing app to PCF is very simple with one command cf push. Following screen print shows that my app push is successful.
~/Downloads/pcflog $ cf push pcf-log-demo -p ./target/pcflog-0.0.1-SNAPSHOT.jar

		state     since                    cpu    memory        disk       details
#0  running   2018-03-08 04:17:00 PM   0.0%   43.8K of 1G   8K of 1G
Of course, you can always verify the app status on your PWS Console.
PWS Console
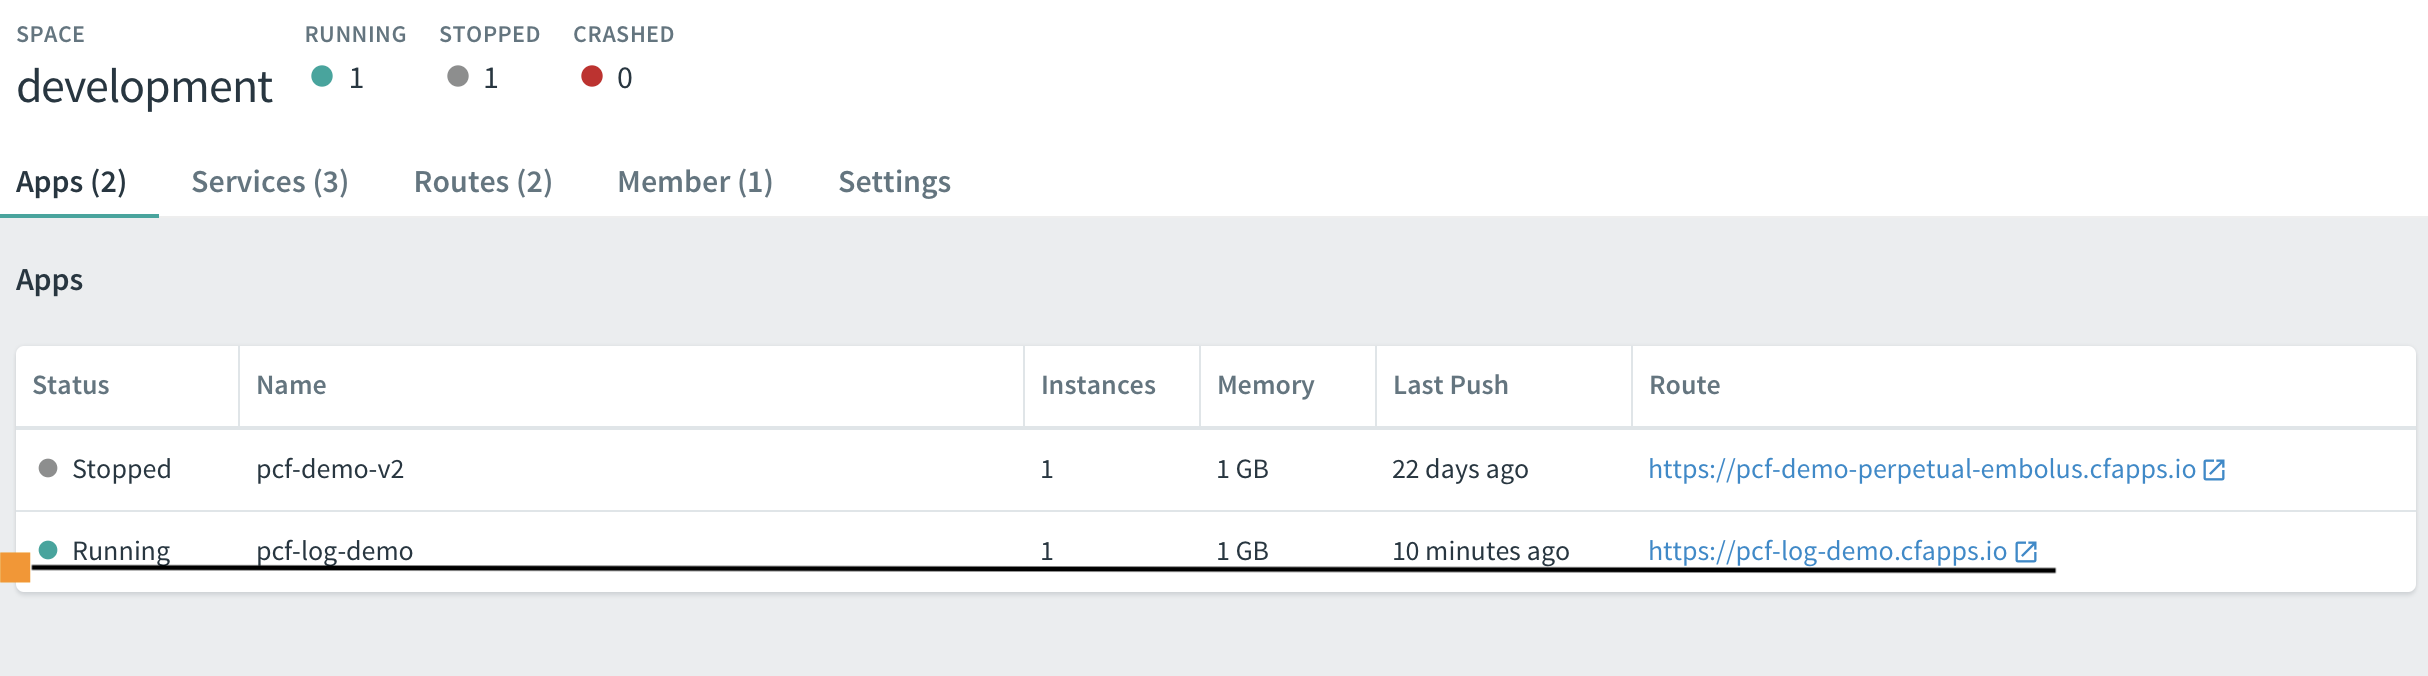
Its time to verify the app on PCF. PCF by default provides a route point to your application as {your-app-name}.cfapps.io. Please see the screen print below where my api call to my app by passing in my name.
I can see the output on screen “Madhu: Your log statement.”. Ok. The app is running and working as expected.
~/Downloads/pcflog $ http http://pcf-log-demo.cfapps.io/api/v1/hello/Madhu
HTTP/1.1 200 OK
Connection: keep-alive
Content-Length: 26
Content-Type: text/plain;charset=UTF-8
Date: Thu, 08 Mar 2018 21:22:06 GMT
X-Vcap-Request-Id: a08352e2-80ac-4239-5c8e-74179366a2ae

Madhu: Your Log statement.

~/Downloads/pcflog $
Now lets try to pull logs from the app using CFCLI. The command to do that is simple. $cf logs {your-app-name}. Here I can see the log statement from my app.
~/Downloads/pcflog $ cf logs pcf-log-demo
Retrieving logs for app pcf-log-demo in org cloudmonkey / space development as...

2018-03-09T12:10:15.26-0500 [RTR/5] OUT pcf-log-demo.cfapps.io - [2018-03-09T17:10:15.206+0000] "GET /api/v1/hello/Madhu HTTP/1.1" 200 0 26 "-" "Mozilla/5.0 (Macintosh; Intel Mac OS X 10_13_3) AppleWebKit/604.5.6 (KHTML, like Gecko) Version/11.0.3 Safari/604.5.6" "10.10.2.227:2584" "10.10.148.72:61074" x_forwarded_for:"100.36.74.10, 10.10.2.227" x_forwarded_proto:"http" vcap_request_id:"4ef29682-cc19-429c-55c4-d7fa9431c618" response_time:0.053996806 app_id:"2295fb9c-176c-47ab-96e9-e736cfb91c51" app_index:"0" x_b3_traceid:"6d02249b20d1757c" x_b3_spanid:"6d02249b20d1757c" x_b3_parentspanid:"-"
2018-03-09T12:10:15.26-0500 [RTR/5] OUT
2018-03-09T12:10:15.37-0500 [RTR/3] OUT pcf-log-demo.cfapps.io - [2018-03-09T17:10:15.307+0000] "GET /favicon.ico HTTP/1.1" 200 0 946 "http://pcf-log-demo.cfapps.io/api/v1/hello/Madhu" "Mozilla/5.0 (Macintosh; Intel Mac OS X 10_13_3) AppleWebKit/604.5.6 (KHTML, like Gecko) Version/11.0.3 Safari/604.5.6" "10.10.2.227:3791" "10.10.148.72:61074" x_forwarded_for:"100.36.74.10, 10.10.2.227" x_forwarded_proto:"http" vcap_request_id:"cdef7da2-57bd-404c-55b2-0d381bbf922c" response_time:0.063308529 app_id:"2295fb9c-176c-47ab-96e9-e736cfb91c51" app_index:"0" x_b3_traceid:"3ecb42e4d552b946" x_b3_spanid:"3ecb42e4d552b946" x_b3_parentspanid:"-"
2018-03-09T12:10:15.37-0500 [RTR/3] OUT
2018-03-09T12:10:15.24-0500 [APP/PROC/WEB/0] OUT 2018-03-09 17:10:15.247  INFO 13 --- [nio-8080-exec-1] c.e.pcflog.PcflogApplication$PcfLogDemo  : Madhu: Your log statement
> Create a free account on Papertrail
Directing logs to a Cloud-hosted Log Management helps us further evaluate the logs. We get more tools to anaylyze, search, also setup notifications based on certain conditions. Here I am going to leverage Papertrail cloud-hosted Log Management system to direct logs from my app instance to my papertrail account.
Please go ahead and signup for a free account on Papertrail.
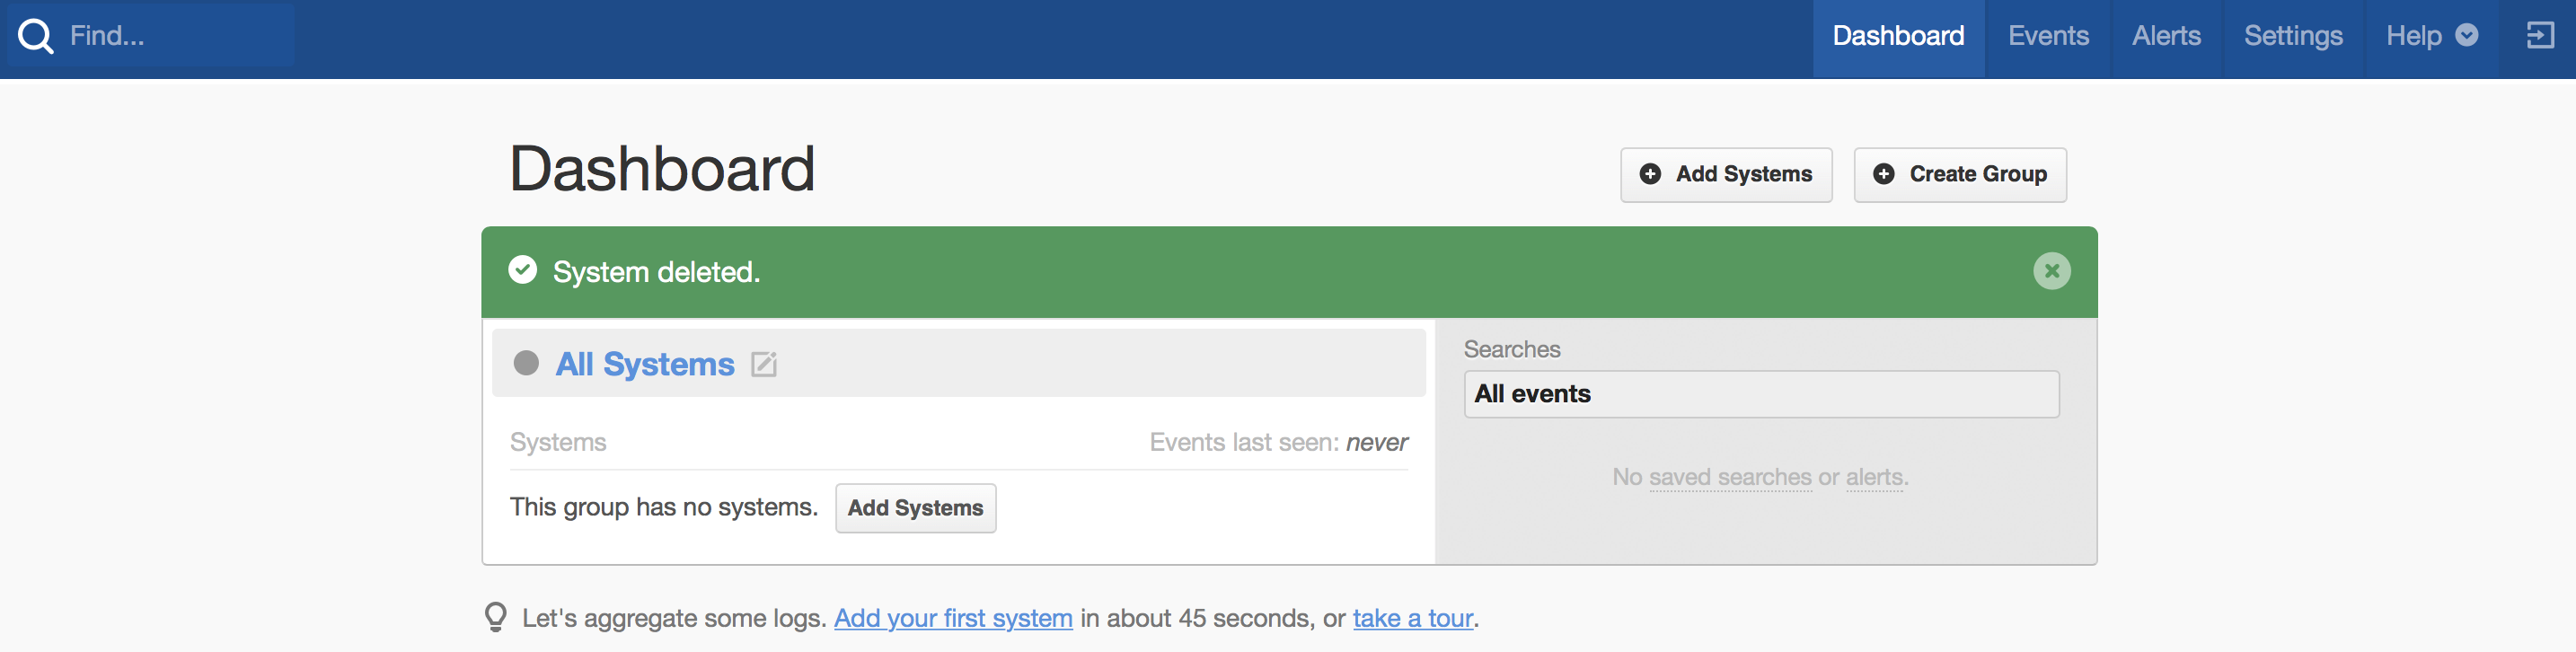
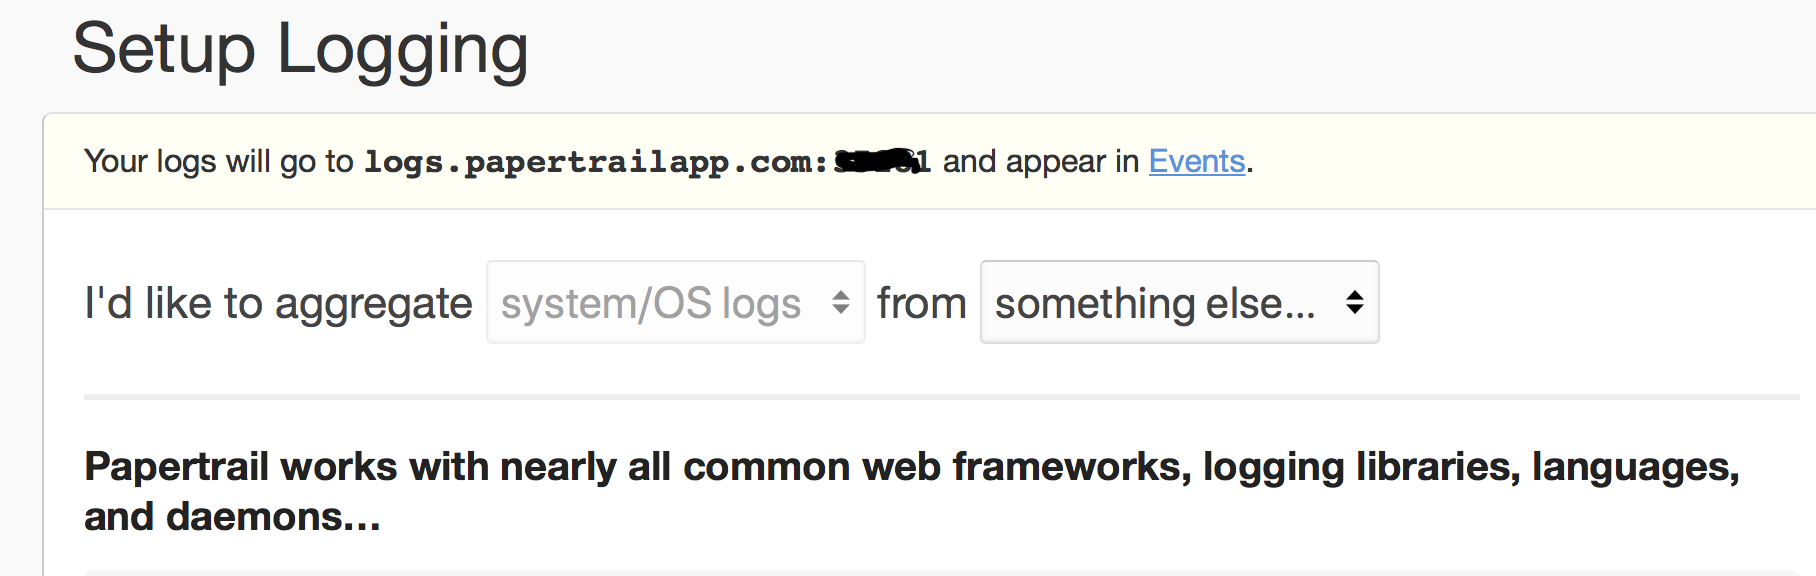
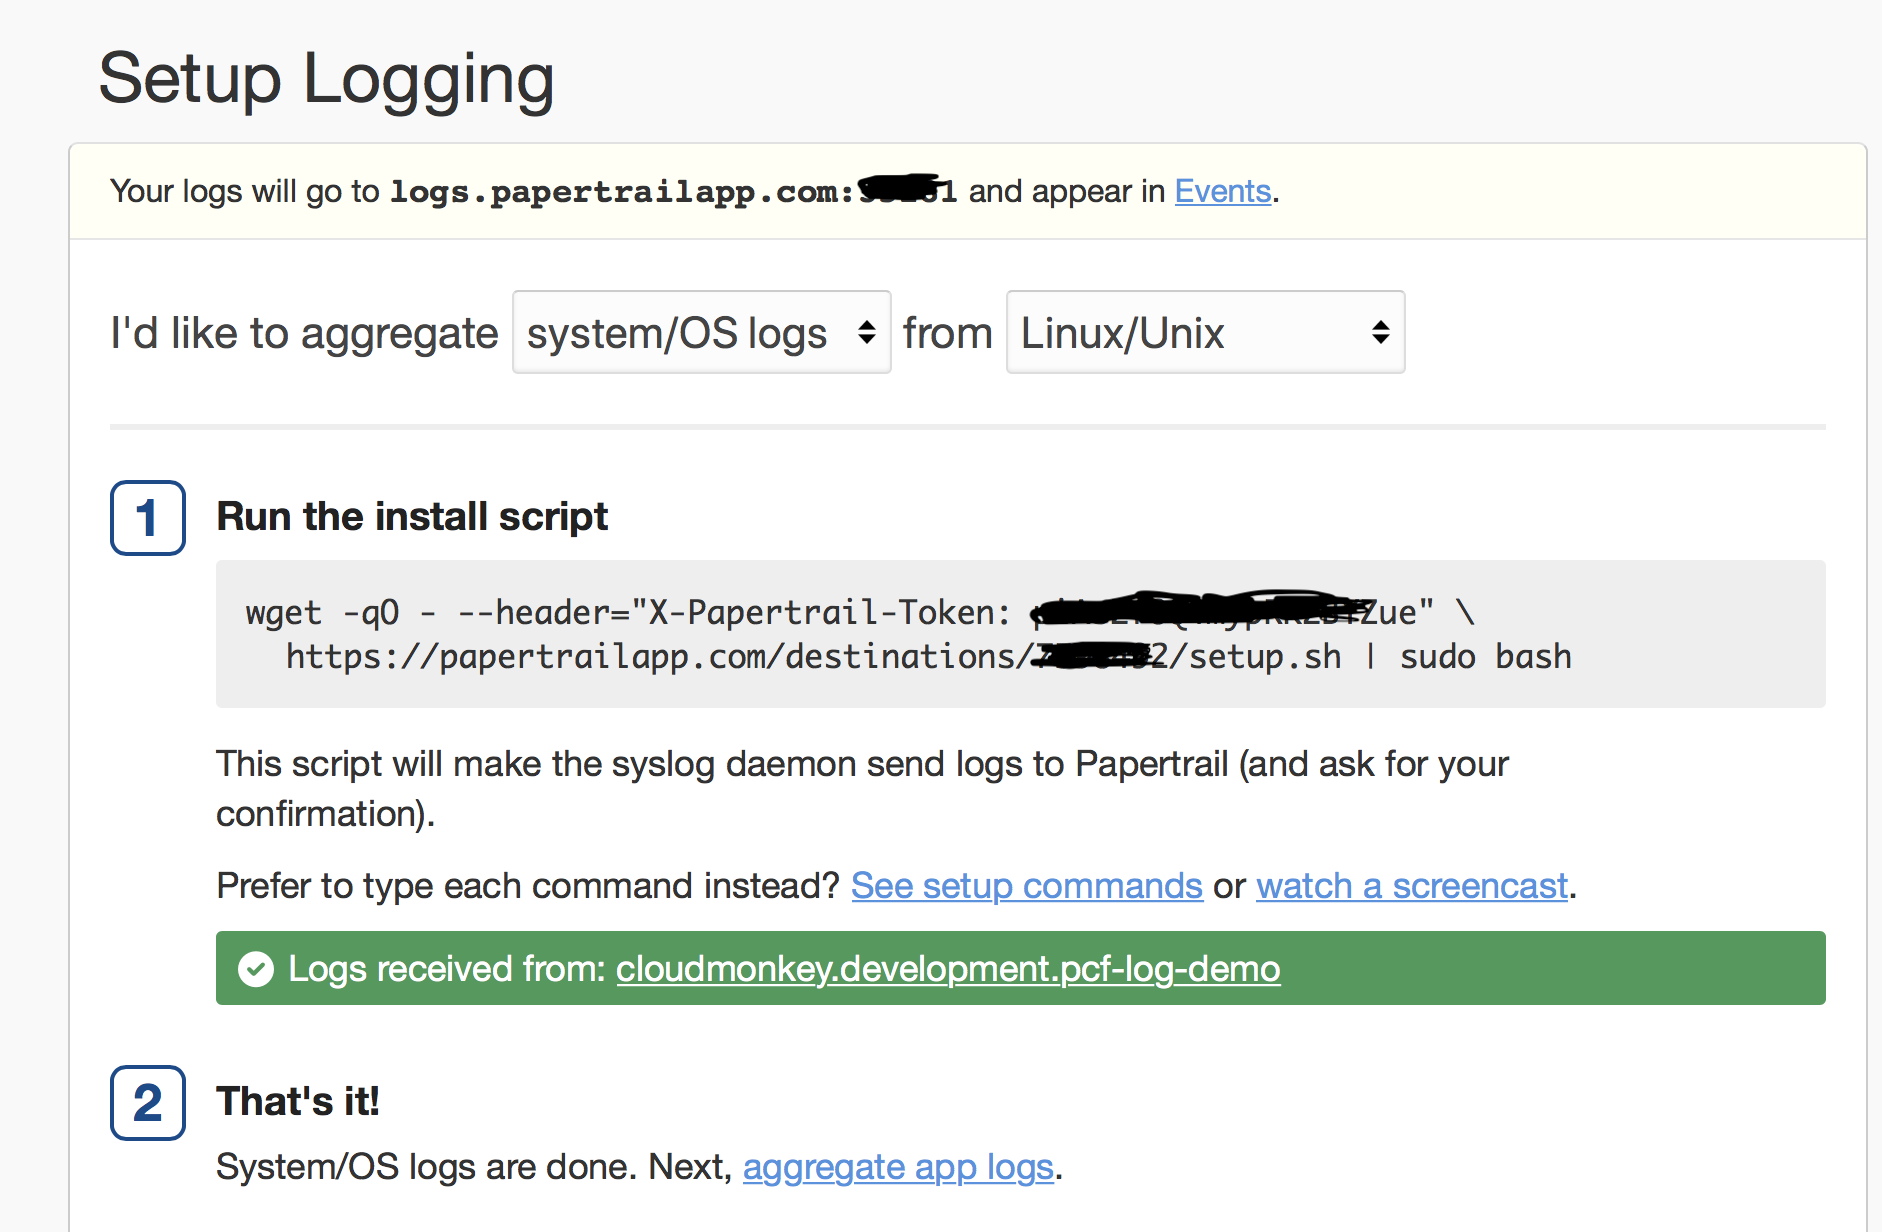
After you login to your Papertrail account, please go ahead and add a system to receive log messages.
> Setup Log Event listener system on papertrail
Copy the log URL provided by Papertrail. We need this URL to configure a Service Broker at PWS.
> Create a Service Broker
At PWS as a first step you need to create a service broker for your Papertrail account. Create a User-Provided-Service using $cf cups {service-name} -l {url from papertrail} command.
~/Downloads/pcflog $ cf cups papertrail-dump-demo -l syslog://logs.papertrailapp.com:<port provided by papertrail>
Creating user provided service papertrail-dump-demo in org cloudmonkey / space development as ...
OK
~/Downloads/pcflog $
> Connect Service Broker to sample application
After the service was created, we need to bind it to the app. CFCLI command $cf bs {app-name} {service-name} does the binding. After successful binding you would see a TIP to restage the app. Sometimes restaging is needed if the service which we are binding may need to configure agents inside the app container. In this example its not necessary.
~/Downloads/pcflog $ cf bs pcf-log-demo papertrail-dump-demo
Binding service papertrail-dump-demo to app pcf-log-demo in org cloudmonkey / space development as ...
OK
TIP: Use 'cf restage pcf-log-demo' to ensure your env variable changes take effect
~/Downloads/pcflog $
> View Logs on Papertrail Web Console
Now you need to invoke the sample application above one more time to generate a log message. After waiting a few seconds the app syslogs would start showing up on Papertrail web console.
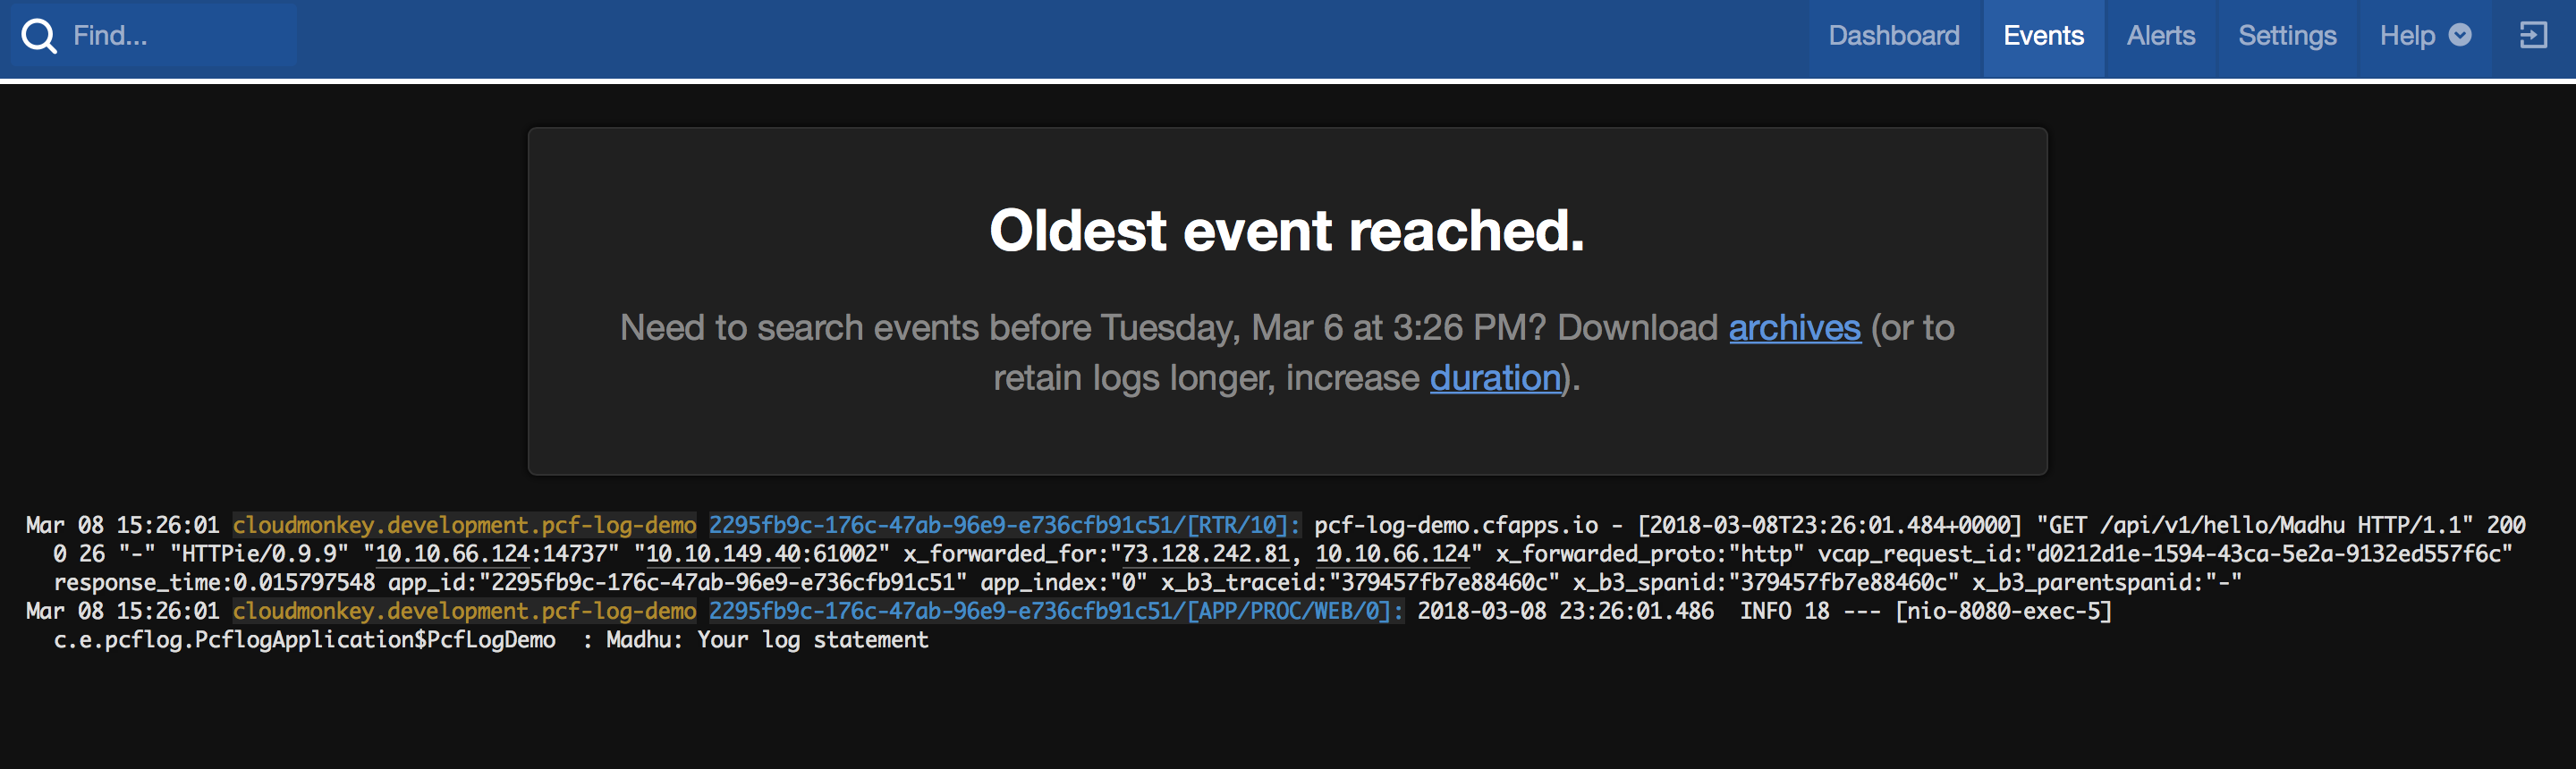

That’s it. Its a very simple demonstration of distributed logging and log management. But, this is very powerful and elegant and makes a developer / operational person’s life easy to debug, troubleshoot a cloud hosted application.
Summary
As distributed systems are hard to debug and maintain, apps run inside immutable containers and virtual machines with ephemeral disks, we need a mechanism to aggregate logs from all running instances. CF Loggregator Component comes to the rescue. It collects logs from all the running instances and provides them as event streams. We can process the stream of logs in various ways like tail the logs using $cf logs {app-name} or divert them to sophisticated log management systems like Papertrail or Splunk. This addresses the logs factor of 12 Factor Apps.
Resources & References
- Cloud Native Apps
- 12 Factor Apps
- Cloud Foundry
- Loggregator documentation @Pivotal
- Pivotal Cloud Foundry Developer Course @Pluralsight
- Papertrail
Related Posts
-
07 Feb 2019 » Flutter- Bottom Navigation Bar- Navigation using Dart Streams & BLoC Pattern
-
12 Jul 2018 » TDD of Microserivce-Nanoservice Combo with a Contract (In other words, SpringBoot-SpringFunction Combo with a Spring RestDocs-Contract)

-
10 Jul 2018 » Deploying a Spring Cloud Function on AWS Lambda Platform using Serverless Framework
